|

|
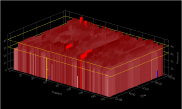
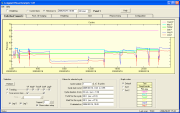
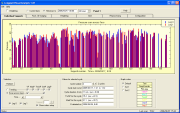
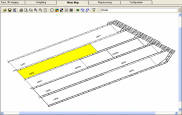
Longwall Visual Analysis
Real-time monitoring of Longwall mining support pressures
- The Longwall Visual Analysis software package was initially
developed by Encore Consulting, but is now fully owned and
developed by LVA Pty Ltd. LVA was founded jointly by David Hoyer
and Alister Waller in 2006.
- LVA is installed on a number of Australian coal mines and
runs 24 hours a day scanning and analysing longwall support
pressures. Please contact LVA
to if you would like to find out more or see a presentation of the
software.
- LVA's web site is www.lva.com.au

Copyright © 2010, Encore Consulting
Pty
Ltd.
www.encoreconsulting.com.au | |