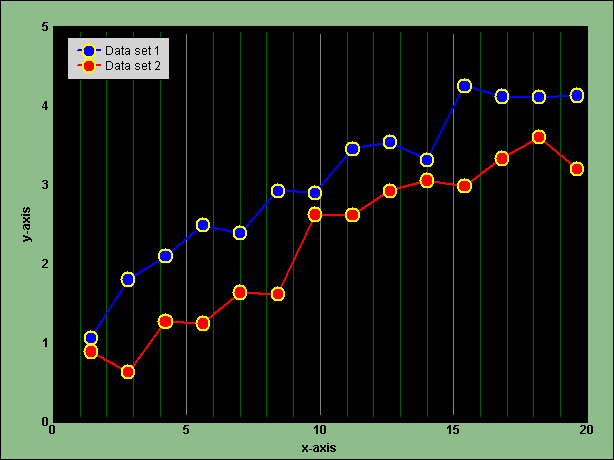
EcGraph Demo6. Two data sets, grid lines, black background.
- Two data sets, grid lines, black background.
- Scroll down below the screenshot image to see the VB code that was used to generate the graph.
The VB code used to generate the above graph...
Public Sub Demo6(EcGraph1 As EcGraph)
'Two data sets, grid lines, black background
Dim i, Color As Long, X As Double, Y As Double
Dim Symbol As Integer, SymbolSize As Single, Line As Integer, Legend$
With EcGraph1
Call .Reset 'Always call "Reset" first
'Start the first graph...
Call .NewGraph("Two data sets, grid lines, black background")
Call .GraphTitleStyle(, , , , , False)
Call .BorderStyle(ecDarkSeaGreen)
Call .PlotAreaColors(ecBlack)
Call .AxisGridStyle(ecGray, ecDarkGreen)
Call .LegendTableStyle(, , 11, 8, , , ecLightGrey, ecLightGrey)
Call .AxisLabelStyle("bold")
Call .AxisTitleStyle("x-axis", "bold")
Call .SelectYaxis 'select the y-axis before adjusting its style
Call .AxisLabelStyle("bold", , -1)
Call .AxisTitleStyle("y-axis", "bold", , -3)
'First data set for this graph
Call .NewDataSet("Data set 1")
Call .DataLine(ecDarkBlue, 2)
Call .SymbolStyle(3, 3.5, ecDarkBlue, ecYellow, 2)
For i = 1 To 14
X = 1.4 * i: Y = Sqr(i) + Rnd
Call .AddDataPoint(X, Y)
Next i
'Second data set for this graph
Call .NewDataSet("Data set 2")
Call .SymbolStyle(3, 3.5, ecDarkRed, ecYellow, 2)
For i = 1 To 14
X = 1.4 * i: Y = Sqr(i) - Rnd
Call .AddDataPoint(X, Y)
Next i
Call .Refresh 'Always end with "Refresh"
End With
End Sub