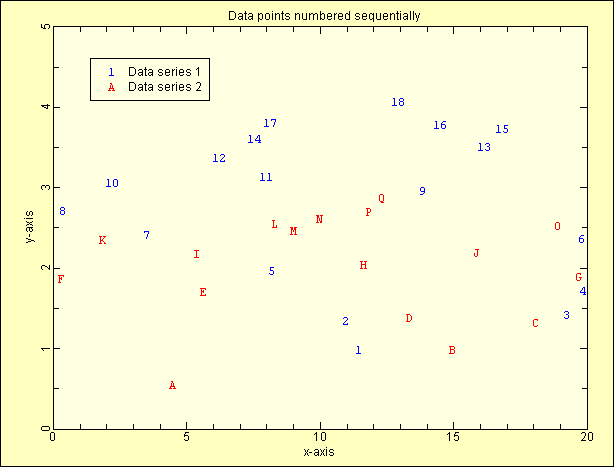
EcGraph Demo14. Data points numbered sequentially
- Data points numbered sequentially.
- Showing two data series of random points plotted as sequential numbers and
letters
The VB code used to generate the above graph...
Public Sub
Demo14(ecGraph1 As ecGraph)
'Data points numbered sequentially
Dim
i, X As Double, Y As Double
With
ecGraph1
Call .Reset
'Always call "Reset" first to clear the page
'Start a new graph on the page..
Call .NewGraph("Data points numbered sequentially")
'Start a new data set on the graph, and add random
points..
Call
.NewDataSet("Data series 1")
Call .SymbolStyle(-1, ,
, , , , , , , , , , "Font=Courier New")
For i = 1 To 18
X = i
Y = Sqr(i) - Rnd(i) / 3
Call
.AddDataPoint(X, Y)
Next
i
'Second data set for this graph
Call .NewDataSet("Data series 2")
Call .SymbolStyle(-2, , , , , , , , , , , , "Font=Courier New")
For i = 2 To 18
X = i
Y = Log(i) / 2 - Rnd / 4
Call
.AddDataPoint(X, Y)
Next
i
Call .Refresh 'Always end with
"Refresh"
End With
End Sub