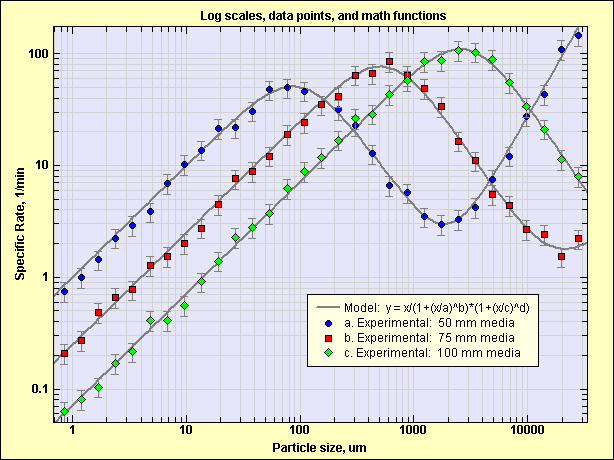
EcGraph Demo12. Log scales, data points, and math functions.
- Log scales, data points, and math functions.
- Scroll down below the screenshot image to see the VB code that was used to generate the graph.
The VB code used to generate the above graph...
Public Sub Demo12(EcGraph1 As EcGraph)
'Log scales, data points, and math functions
Dim MathFunc$, i, rr, r As Double, X As Double, Y As Double
With EcGraph1
Call .Reset 'Always call "Reset" first to clear the page
'Start a new graph on the page..
Call .NewGraph("Log scales, data points, and math functions")
Call .GraphTitleStyle(, "bold")
Call .PlotAreaColors(ecLavender)
Call .LegendTableStyle(, , 50, 64)
Call .AxisStyle(, , True)
Call .AxisGridStyle(ecLightGrey, ecLightGrey, True, True)
Call .AxisLabelStyle("bold")
Call .AxisTitleStyle("Particle size, um", "bold")
Call .SelectYaxis
Call .AxisStyle(, , True)
Call .AxisGridStyle(ecLightGrey, ecLightGrey, True, True)
Call .AxisLabelStyle("bold", , -1)
Call .AxisTitleStyle("Specific Rate, 1/min", "bold")
'Add a math function..
MathFunc$ = "x/(1+(x/100)^2.4)*(1+(x/2000)^3.2)"
Call .NewDataSet("Model: y = x/(1+(x/a)^b)*(1+(x/c)^d)", True)
Call .AddMathFunc(MathFunc$)
Call .DataLine(ecGray, 2)
'Add a math function..
MathFunc$ = "x/(1+(x/600)^2.5)*(1+(x/18000)^2.5)/4"
Call .NewDataSet("Simulated: y = " + MathFunc$, False)
Call .AddMathFunc(MathFunc$)
Call .DataLine(ecGray, 2)
'Add a math function..
MathFunc$ = "x/(1+(x/3000)^2.5)/14"
Call .NewDataSet("Simulated: y = " + MathFunc$, False)
Call .AddMathFunc(MathFunc$)
Call .DataLine(ecGray, 2)
'Start a new data set on the graph, and add random points..
Call .NewDataSet("a. Experimental: 50 mm media")
Call .SymbolStyle(3, 1.6, ecDarkBlue, ecBlack, 1, , , , , False)
Call .DataLine(, 0, 0)
X = 0.6: r = 0.2
For i = 1 To 31
X = X * Sqr(2)
Y = X / (1 + (X / 100) ^ 2.4) * (1 + (X / 2000) ^ 3.2) * ((1 - r) + 2 * r * Rnd)
Call .AddDataPoint(X, Y, Y * r)
Next i
'Start a new data set on the graph, and add random points..
Call .NewDataSet("b. Experimental: 75 mm media")
Call .SymbolStyle(, 1.6, ecDarkRed, ecBlack, 1, , , , , False)
X = 0.6
For i = 1 To 31
X = X * Sqr(2)
Y = X / (1 + (X / 600) ^ 2.5) * (1 + (X / 18000) ^ 2.5) * ((1 - r) + 2 * r * Rnd) / 4
Call .AddDataPoint(X, Y, Y * r)
Next i
'Start a new data set on the graph, and add random points..
Call .NewDataSet("c. Experimental: 100 mm media")
Call .SymbolStyle(, 2.2, vbGreen, ecBlack, 1, , , , , False)
X = 0.6
For i = 1 To 31
X = X * Sqr(2)
Y = X / (1 + (X / 3000) ^ 2.5) * ((1 - r) + 2 * r * Rnd) / 14
Call .AddDataPoint(X, Y, Y * r)
Next i
Call .Refresh 'Always end with "Refresh"
End With
End Sub