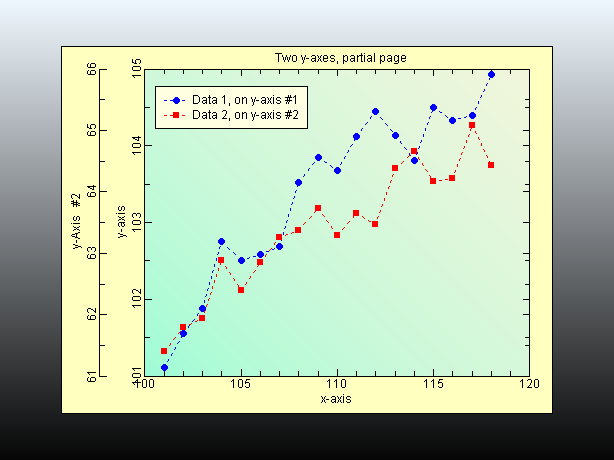
EcGraph Demo10. Two y-axes, partial page.
- Two y-axes, partial page.
- Scroll down below the screenshot image to see the VB code that was used to generate the graph.
The VB code used to generate the above graph...
Public Sub Demo10(EcGraph1 As EcGraph)
'Two y-axes, partial page
Dim i, X As Double, Y As Double
With EcGraph1
Call .Reset 'Always call "Reset" first
Call .NewGraph("Two y-axes, partial page") 'Start a new graph on the page
Call .GraphPosition(10, 10, 80, 80)
Call .PageColors(ecBlack, ecAliceDarkBlue, 90)
Call .BorderStyle(, , , , , , 22, 6, 6, 10)
Call .LegendTableStyle(, , 19, 11)
Call .PlotAreaColors(ecAquaMarine, ecBeige, 45, -0.3)
Call .NewDataSet("Data 1, on y-axis #1") 'Start a new data set on the graph
Call .DataLine(, , 2) 'dotted
For i = 1 To 18 'Add some data points to the graph
X = 100 + i
Y = 100 + Sqr(i) + Rnd
Call .AddDataPoint(X, Y)
Next i
Call .NewYAxis("y-Axis #2")
Call .NewDataSet("Data 2, on y-axis #2") 'Start a new data set on the graph
Call .DataLine(, , 2) 'dotted
For i = 1 To 18 'Add some data points to the graph
X = 100 + i
Y = 60 + Sqr(i) + Rnd
Call .AddDataPoint(X, Y)
Next i
Call .Refresh 'Always end with "Refresh"
End With
End Sub