|
|
ecGraph Demo8. Two graphs on the Page.
- Two graphs on the Page.
- Scroll down below the screenshot image to see the VB code that
was used to generate the graph.
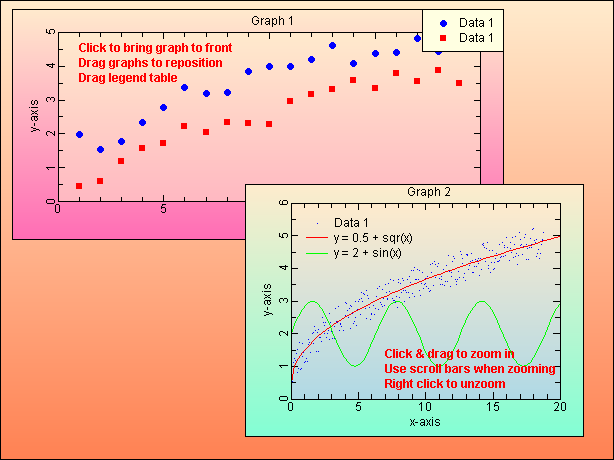
The VB code used to generate the above graph...
Public Sub Demo8(ecGraph1 As ecGraph)
'Two graphs on the Page
Dim
MathFunc$, S$, i, Color As Long, X As Double, Y As Double
Dim Symbol As Integer, SymbolSize As Single, Line As Integer, Legend$
With ecGraph1
Call .Reset
'Always call "Reset" first
Call .PageColors(ecCoral, ecBlanchedAlmond)
'Start the first
graph...
Call .NewGraph("Graph
1")
Call .GraphPosition(2, 2, 80, 50)
Call
.BorderStyle(ecHotPink, ecBlanchedAlmond, , , , , 12, 6, 6, 10)
Call
.PlotAreaColors(ecLightPink, ecBlanchedAlmond)
'First data set for this graph
Call
.NewDataSet("Data 1")
For i = 1
To 19
X = i: Y = Sqr(i) + Rnd
Call .AddDataPoint(X, Y)
Next i
'Second data set for this graph
Call
.NewDataSet("Data 1")
For i = 1
To 19
X = i: Y = Sqr(i) - Rnd
Call .AddDataPoint(X, Y)
Next i
'Add text..
Call .NewDataSet("Text")
S$ =
"Click to bring graph to front" + vbCrLf
+ "Drag graphs to reposition" + vbCrLf +
"Drag legend table"
Call
.AddText(S$, 5, 95, 0, "bold", ecDarkRed,
0, True)
'Second
graph...
Call .NewGraph("Graph
2")
Call .GraphPosition(40, 40, 55, 55)
Call
.BorderStyle(ecAquaMarine, ecBlanchedAlmond, , , , , 12, 5, 6, 10)
Call
.LegendTableStyle(, , 15, 10, ecGray, 0, , , , , , True)
Call .PlotAreaColors(ecLightDarkBlue,
ecBlanchedAlmond)
Call
.NewDataSet("Data 1")
Call
.SymbolStyle(2)
For i = 1 To 300
X = i / 16: Y = Sqr(X) + Rnd
Call .AddDataPoint(X, Y)
Next i
'Add a math function..
MathFunc$ = "0.5 + sqr(x)"
Call
.NewDataSet("y = " + MathFunc$)
Call
.AddMathFunc(MathFunc$, 0, 20)
'Add a math
function..
MathFunc$ = "2 + sin(x)"
Call .NewDataSet("y =
" + MathFunc$)
Call .AddMathFunc(MathFunc$, 0, 20)
'Add text..
Call .NewDataSet("Text")
S$ =
"Click & drag to zoom in" + vbCrLf +
"Use scroll bars when zooming" + vbCrLf +
"Right click to unzoom"
Call
.AddText(S$, 35, 27, 0, "bold",
vbDarkRed, 0, True)
Call .Refresh 'Always end
with "Refresh"
End With
End Sub
Copyright © 2007,
Encore Consulting Pty Ltd.
www.encoreconsulting.com.au
|