|
|
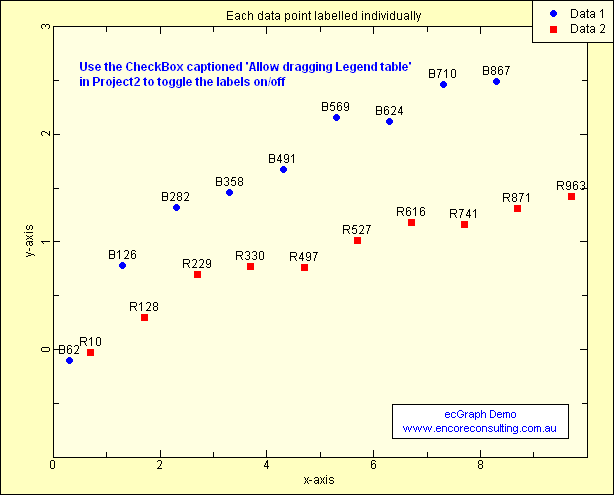
ecGraph Demo15. Tag labels on each data
point
- Each data point labelled individually.
- Showing two data series of random points with random tags on
each point
The VB code used to generate the above graph...
Public Sub Demo15(ecGraph1 As ecGraph)
'Each data point labelled individually
Dim i, X As Double, Y As
Double
With ecGraph1
Call .Reset
'Always call "Reset" first to clear the
page
'Start a new graph
on the page..
Call .NewGraph("Each data
point labelled individually")
'Start a new
data set on the graph, and add random points..
Call
.NewDataSet("Data 1")
For i = 0
To 9
X = i + 0.3
Y = Sqr(i) - Rnd(i) / 3
'Assign a random tag to each point
Call .AddDataPoint(X, Y, , , "B" + Trim(Str(Int(100 * (i + Rnd)))))
Next i
'Second data set for this graph
Call
.NewDataSet("Data 2")
For i = 0
To 9
X = i + 0.7: Y = Sqr(i) / 2
- Rnd / 4
Call .AddDataPoint(X, Y, , , "R" + Trim(Str(Int(100 * (i + Rnd)))))
Next i
Call .NewDataSet("")
Call .AddText("Use the
CheckBox captioned 'Allow dragging Legend table'" + vbCrLf +
_
"in Project2 to toggle the labels on/off", 0.5,
2.7, 0, "bold", vbBlue, 0, 0)
Call .Refresh 'Always
end with "Refresh"
End With
End Sub
Copyright © 2007,
Encore Consulting Pty Ltd.
www.encoreconsulting.com.au
|